Temperature for the last 420,000 years
Temperature for the last 420,000 years
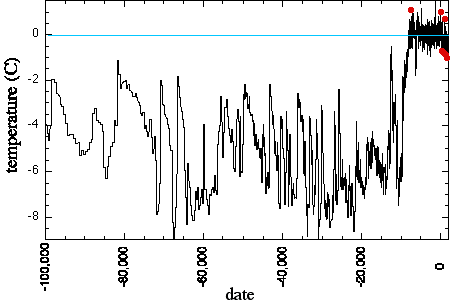
The last glaciation began 116,000 years ago. The data from the Greenland ice core GISP2 goes back only 100,000 years. Here is the graph:

This graph, like the ones for shorter periods, is taken from Muller et al. Their commentary is worth repeating:
|
During the glacial, not only was the temperature lower by 8 Celsius (and some estimates put it at more than 12 Celsius Ė the record is a superposition of ice volume and temperature), but the climate was extremely irregular. The irregularities in temperature during the glacials, the wild bumps and wiggles that cover much of Figure 1-4, are real, not an artifact of poor measurement. The same bumps and wiggles are seen in two separate cores in Greenland, and in data taken from sea floor records found off the California coast. The ability to adapt quickly during this wild climate ride may have given a substantial advantage to adaptable animals, such as humans, and made it difficult for other large fauna to survive. Maybe it was these rapid changes, and not the rapaciousness of humans, that drove the mammoths, camels, giant ground sloths and giant beavers (the size of bears) of North America extinct.
|
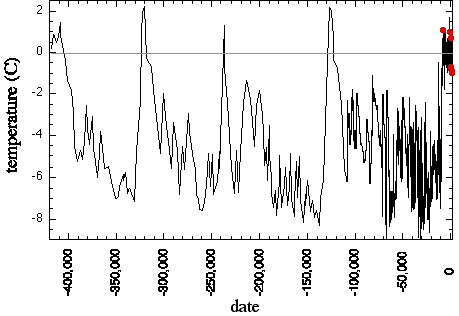
Ice cores have also been taken in Antarctica, and the data from the Russian base at Vostok, Antarctica, goes back through several ice ages:

The data in this graph is deduced from deuterium, rather than oxygen isotopes, as a temperature proxy, and the last part of the graph is
taken from the Vostok data shown above. I found no evidence that anyone disputes these temperatures, so we won't go into the
calculations leading from the proxy measurements to temperature.
Again, I cannot improve on the commentary provided by
Muller et al. :
|
From this plot, it is clear that most of the last 420 thousand years (420 kyr) was spent in ice age. The brief periods when the record peaks above the zero line, the interglacials, typically lasted from a few thousand to perhaps twenty thousand years.
These data should frighten you. All of civilization developed during the last interglacial, and the data show that such interglacials are very brief. Our time looks about up. Data such as these are what led us to state, in the Preface, that the next ice age is about to hit us, any millennium now. It does not take a detailed theory to make this prediction. We donít necessarily know why the next ice age is imminent (at least on a geological time scale), but the pattern is unmistakable.
The real reason to be frightened is that we really donít understand what causes the pattern. We donít know why the ice ages are broken by the short interglacials. We do know something Ė that the driving force is astronomical.
|
The cited source is the introduction to a forthcoming book on ice ages and their causes. The principal author became interested in ice ages as a New York City teenager after seeing the following magazine cover:

Temperature data from other sources goes back 3 million years, showing ice ages coming and going with a shorter period (41,000 years) than
the (roughly) 100,000 years shown above. Before that, people think there were no major ice ages, and the temperature did not drop below the
1950 level. But for analyzing our present situation, it seems that the past 420,000 years should be enough.
|


